3QFY2018 Result Update | Media
February 14, 2018
Asian Granito
NEUTRAL
CMP
`519
Performance Update
Target Price
-
Y/E March (` cr)
3QFY18
3QFY17
% yoy
2QFY18
% qoq
Investment Period
12 Months
Net sales
264
248
6.4
274
(3.9)
Stock Info
EBITDA
36
34
5.6
37
(2.4)
Sector
Ceramic
Market Cap (` cr)
1,560
EBITDA margin (%)
13.7
13.8
(10bp)
13.5
21bp
Net Debt (` cr)
315
Beta
1.0
Adjusted PAT
12
13
(7.7)
16
(27.7)
52 Week High / Low
617/265
Avg. Daily Volume
40,763
Source: Company, Angel Research
Face Value (`)
10
BSE Sensex
34,300
For 3QFY2018, Asian Granito (AGL) posted results in line with our expectations
Nifty
10,540
Reuters Code
ASGI.BO
on top-line basis, however bottom-line disappointed. Revenue grew by ~6% yoy
Bloomberg Code
ASIAN.IN
(after adjusting exercise duty top-line growth grew ~13.8% ) to `264cr, driven by
Shareholding Pattern (%)
strong volume growth of ~25%. On the operating front, margins contracted by
Promoters
32.7
MF / Banks / Indian Fls
7.3
10bps yoy due to higher power (gas price rose more than 10% during the
FII / NRIs / OCBs
5.1
Indian Public / Others
55.0
quarter) and employee costs. This led to PAT de-growth of ~8% yoy to `12cr.
Abs.(%)
3m
1yr
3yr
Top-line driven by strong volume growth: The company’s top-line grew by ~6%
Sensex
3.8
21.0
19.1
AGL
5.5
88.1
326.4
yoy to `264cr (after adjusting exercise duty top-line growth grew ~13.8%) on the
back of strong volume growth (up by ~25%). In the Tiles & Quartz segment, the
company has reported ~25% & 40% volume growth respectively. However, the
Marble segment witnessed a sharp volume decline of ~37%.
Increase in power and employee costs impacted the operating margins: On the
operating front, margins contracted by 10bps yoy due to higher power (gas price
rose more than 10% during the quarter) and employee costs. This led to PAT de-
growth of ~8% yoy to `12cr.
Outlook and Valuation: We expect various initiatives taken by the government like
smart cities, housing for all by 2022, and push towards providing sanitation, to
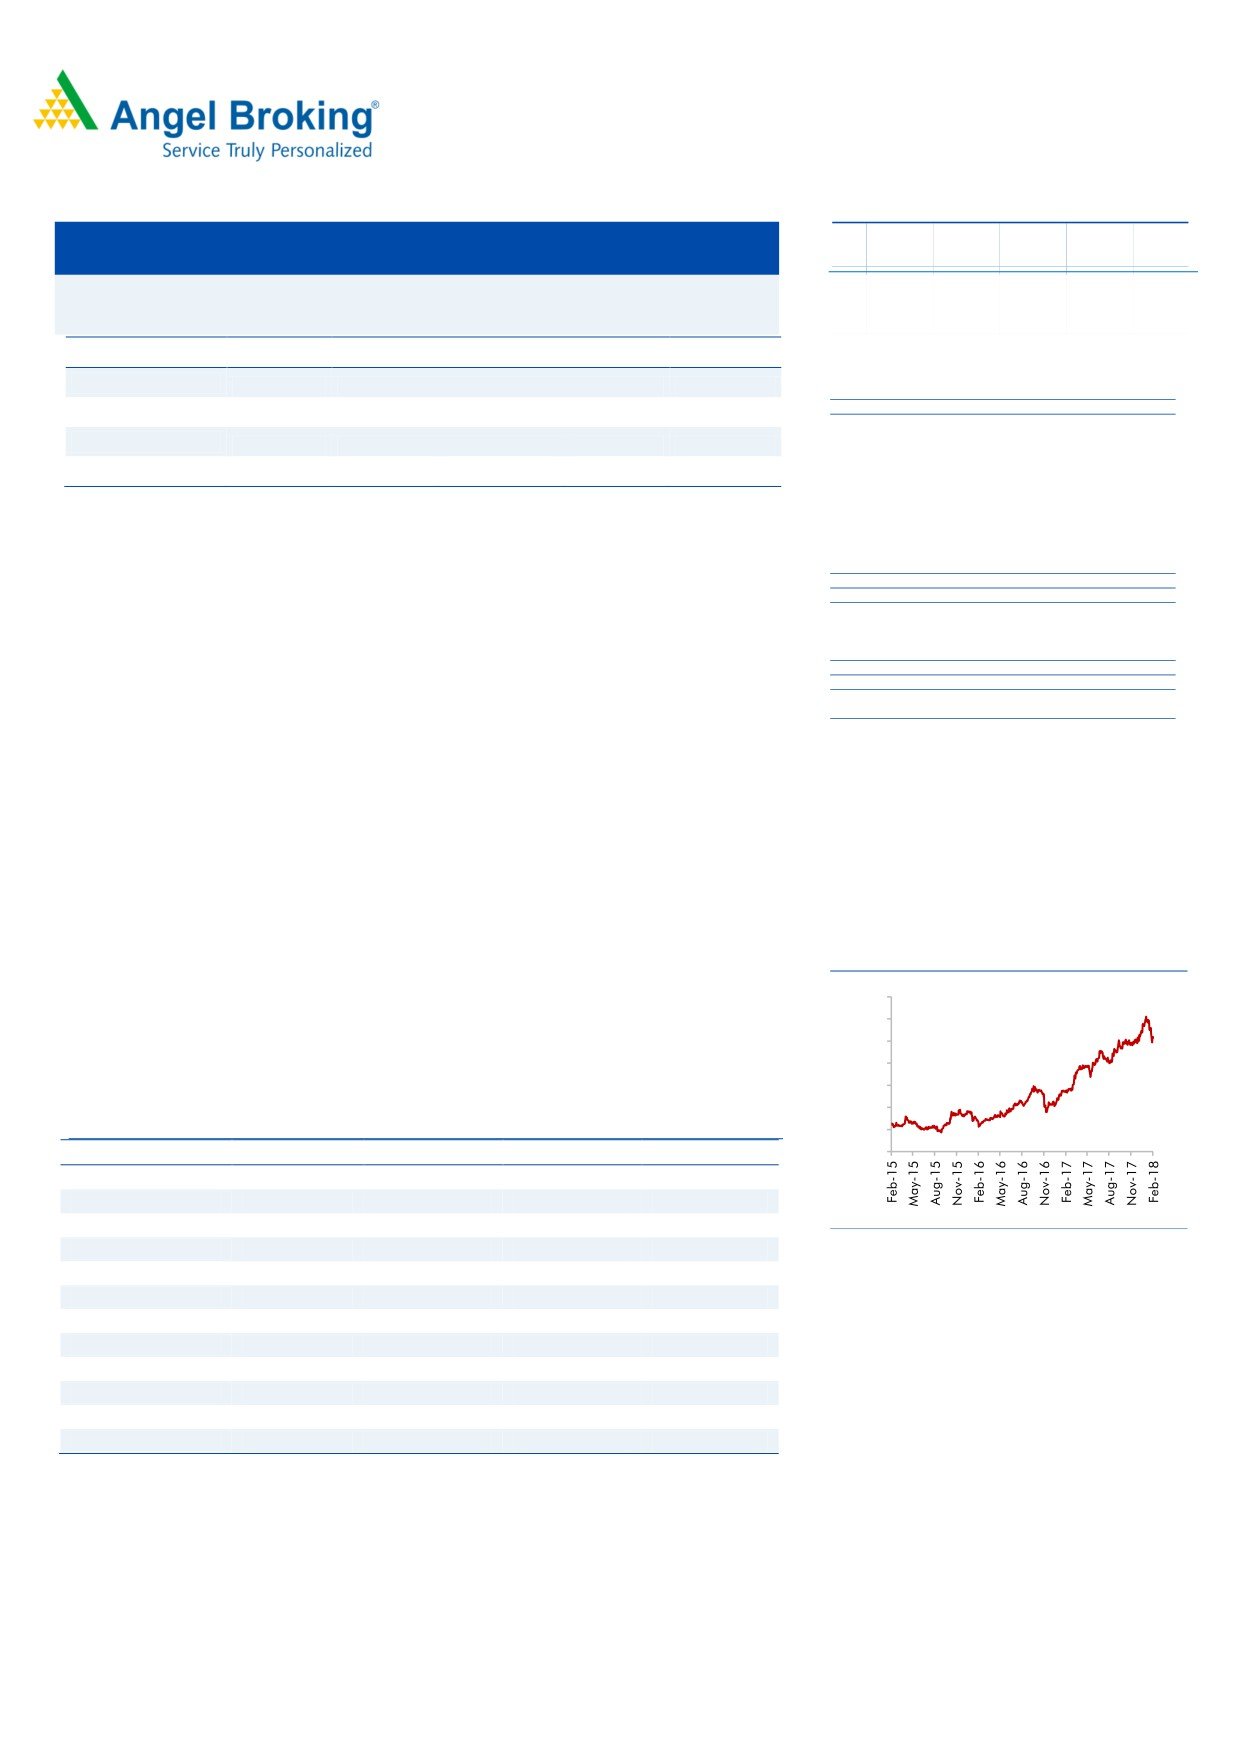
3-year price chart
further lead to creation of new demand avenues for entry level or lower priced
700
tiles (ceramic tiles). We expect AGIL to report net revenue CAGR of ~8% to
600
~`1,253cr over FY2017-19E. On bottom-line front, we expect CAGR of ~18% to
500
`55cr over FY2017-19E owing to better product mix, higher B2C sales and
400
amalgamation synergy. Currently we have neutral rating on stock.
300
200
Key financials
100
Y/E March (` cr)
FY2016
FY2017
FY2018E
FY2019E
0
Net sales
994
1,066
1,130
1,253
% chg
18.1
7.2
6.0
10.9
Net profit
25
39
52
55
Source: Company, Angel Research
% chg
24.8
39.1
52.5
54.8
EBITDA margin (%)
9.1
11.6
13.2
12.2
EPS (`)
8.2
13.0
17.4
18.2
P/E (x)
63.0
39.9
29.7
28.5
P/BV (x)
4.3
3.9
3.4
3.1
RoE (%)
6.8
9.8
11.6
10.8
Amarjeet S Maurya
RoCE (%)
9.0
11.9
14.8
13.9
EV/Sales (x)
1.9
1.8
1.6
1.5
022-39357800 Ext: 6831
EV/EBITDA (x)
20.7
15.2
12.4
12.1
Source: Company, Angel Research, Note: CMP as of February 12, 2018
Please refer to important disclosures at the end of this report
1
Asian Granito| 3QFY2018 Result Update
Exhibit 1: 3QFY2018 Consolidated Performance
Y/E March (` cr)
3QFY18
3QFY17
% yoy
2QFY18
% qoq
9MFY18
9MFY17
% chg
Net Sales
264
248
6.4
274
(3.9)
764
731
4.5
Consumption of RM
129
122
5.9
143
(9.8)
390
386
0.9
(% of Sales)
49.0
49.2
52.2
51.0
52.8
Staff Costs
19
15
25.8
22
(13.5)
61
45
34.6
(% of Sales)
7.4
6.2
8.2
8.0
6.2
Other Expenses
79
76
3.4
72
10.1
210
207
1.8
(% of Sales)
29.9
30.7
26.1
27.5
28.3
Total Expenditure
228
214
6.5
237
(4.1)
661
638
3.6
Operating Profit
36
34
5.6
37
(2.4)
103
93
10.9
OPM
13.7
13.8
13.5
13.4
12.7
Interest
11
12
(7.9)
9
20.9
28
30
(5.5)
Depreciation
6
6
(2.0)
5
19.8
18
18
2.8
Other Income
1
0
156.7
1
(47.6)
2.41
0.6
301.7
PBT (excl. Ext Items)
20.3
16.9
20.3
24.7
(17.9)
59
46
28.5
Ext (Income)/Expense
-
-
-
-
-
PBT (incl. Ext Items)
20
17
20.3
25
(17.9)
59
46
28.5
(% of Sales)
7.7
6.8
9.0
7.7
6.2
Provision for Taxation
7
3
126.5
11
(30.7)
21
15
42.5
(% of PBT)
36.7
19.5
43.4
37
33
Reported PAT
13
14
(5.4)
14
(8.2)
37
31
21.6
PATM
4.9
5.5
5.1
4.9
4.2
Minority Interest After NP
Profit/Loss of Associate Company
(1)
(1)
2
2
2
Reported PAT
12
13
(7.7)
16
(27.7)
39
32
21.0
Source: Company, Angel Research
February 14, 2018
2
Asian Granito| 3QFY2018 Result Update
Key investment arguments
Focus on high value products
AGIL’s current vitrified sales (45%) are lower in comparison to its peers like
Somany Ceramics (50%) and Kajaria Ceramics (63-64%). Recently, AGIL has
launched various products in premium segments like Imperio, Jumbo - Double
Charge, CARARRA White, XXL - Polished Glazed Vitrified Tiles and Polished
Vitrified Tiles (Double Charge). Going forward, we expect AGIL’s profit margins to
improve due to increase in focus on higher vitrified product sales, which is a high
margin segment.
Margins to get a leg up post shift from B2B to B2C
AGIL has continuously focused on improving B2C sales from the current levels
(37% in FY17). It is expected to reach up to 50% over next 3 years following
multiple initiatives taken to increase direct interaction with customers including
strengthening distribution network, launch of exclusive brand showrooms, trade
schemes on high value products and participation in key trade exhibitions.
Further strengthening distribution network
AGIL has an extensive marketing and distribution network, comprising more than
5,780 dealers and sub-dealers. Currently, the company has 200+ exclusive dealer
showrooms, on top of which it plans to add 500 new showrooms in next 3 years.
The company also runs 16 large-format exclusive corporate display stores for
dealers and architects. Going forward, we expect the company to continue to
expand its network through dealers & sub-dealers.
February 14, 2018
3
Asian Granito| 3QFY2018 Result Update
Outlook and Valuation
We expect various initiatives taken by the government like smart cities, housing for
all by 2022, and push towards providing sanitation, to further lead to creation of
new demand avenues for entry level or lower priced tiles (ceramic tiles). We expect
AGIL to report a net revenue CAGR of ~8% to ~`1,253cr over FY2017-19E. On
bottom-line front, we expect CAGR of ~18% to `55cr over FY2017-19E owing to
better product mix, higher B2C sales and amalgamation synergy. Currently we
have neutral rating on stock.
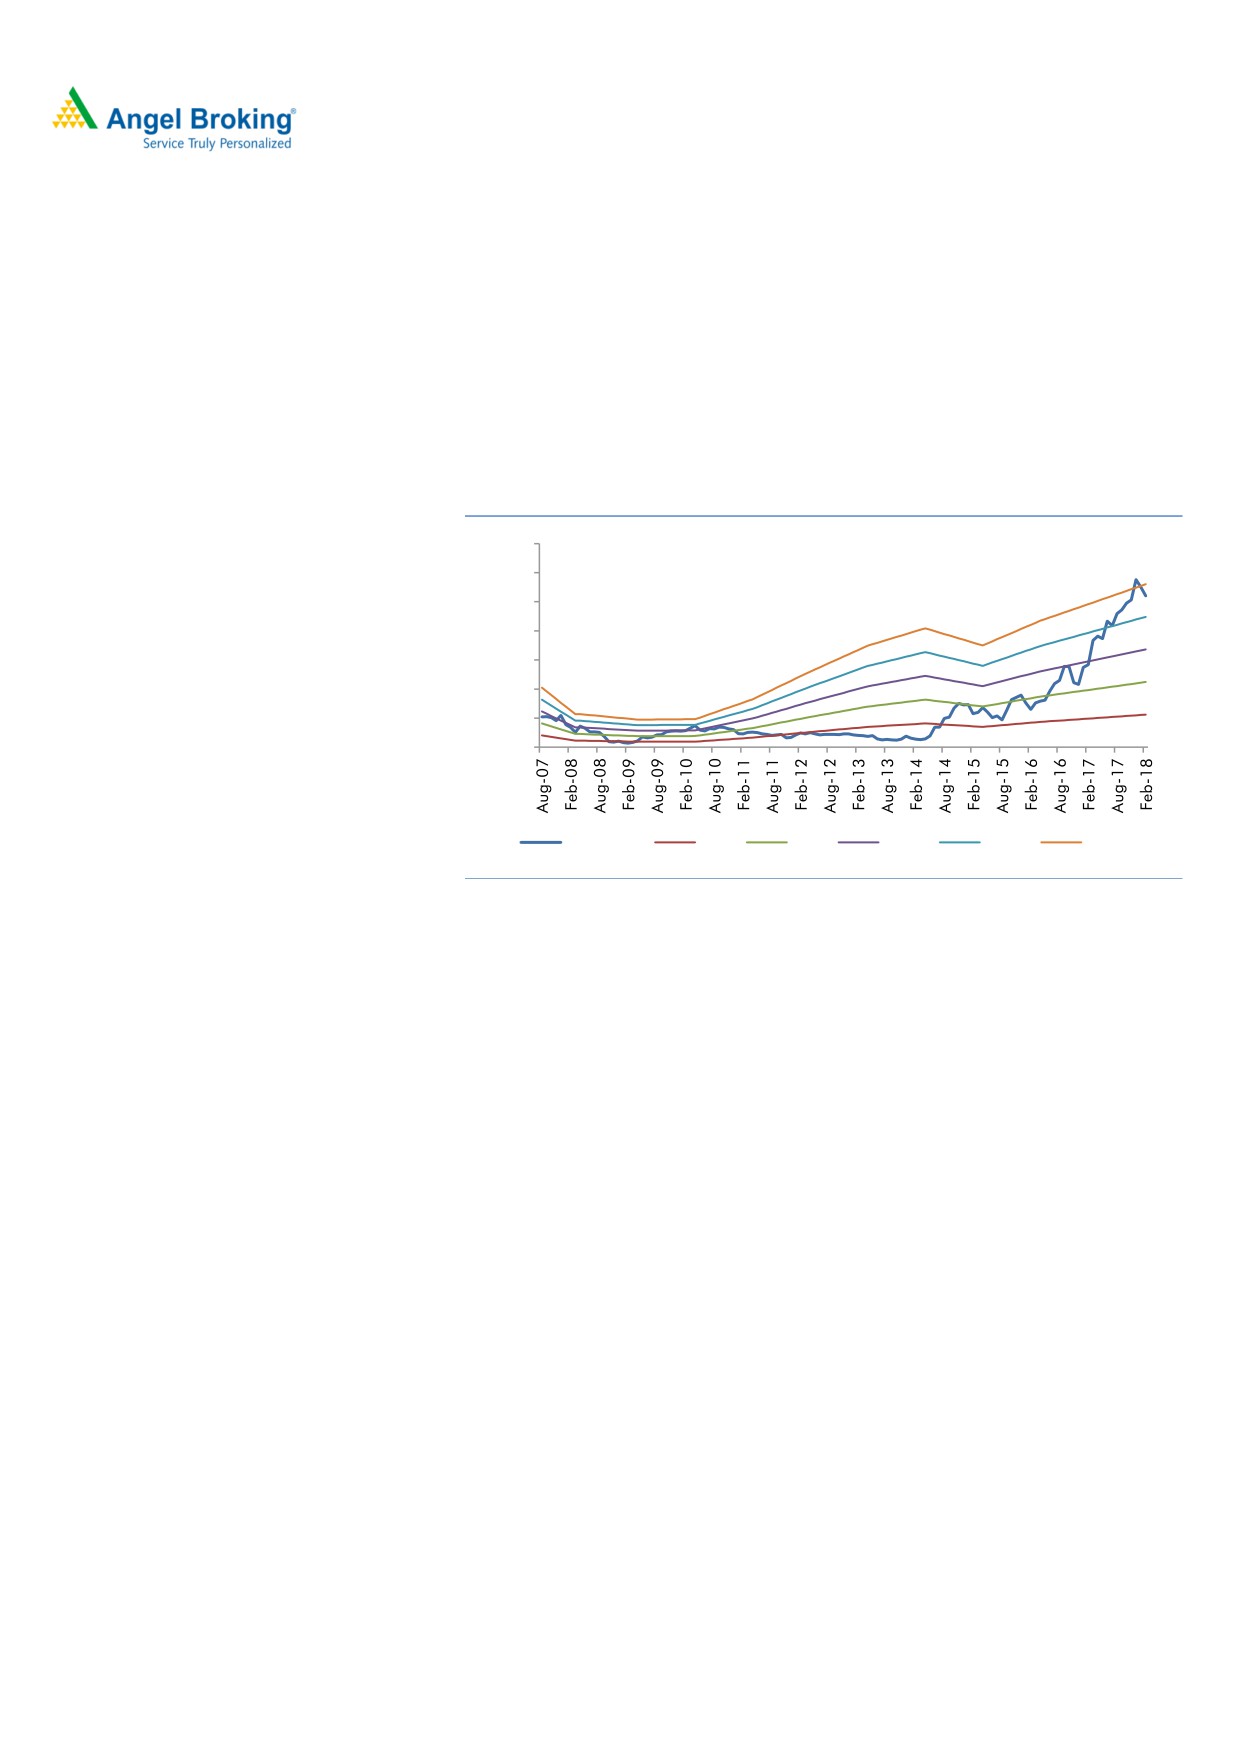
Exhibit 2: One year forward PE Chart
700
600
500
400
300
200
100
0
Share Price
4.0 X
8.0 X
12.0 X
16.0 X
20.0 X
Source: Company, Angel Research
Risks
1) Lower than expected recovery in real estate industry can impact the overall
performance (~65% revenue comes from B2B business).
2) Increase in gas prices can impact the company’s operating performance.
Company Background
Asian Granito India Limited (AGL) was established in 2000 by Mr. Kamlesh Patel
and Mr. Mukesh Patel. AGL is one of the top three Indian Ceramic Companies
engaged in the business of manufacturing, and trading of Ceramic Wall, Floor,
Vitrified Tiles, Marble & Quartz Headquartered in Gujarat. AGL has
8
manufacturing facilities in Gujarat. AGL has production of 1,00,000 sqm per day
including outsourcing. Pan India marketing & distribution network of more than
5,780 dealers and sub-dealers and over 206+ showrooms with global footprint
with exports to over 53 countries.
February 14, 2018
4
Asian Granito| 3QFY2018 Result Update
Consolidated Profit & Loss Statement
Y/E March (` cr)
FY2015
FY2016
FY2017
FY2018E FY2019E
Total operating income
842
994
1,066
1,130
1,253
% chg
9.0
18.1
7.2
6.0
10.9
Total Expenditure
781
904
942
981
1,100
Cost of Materials
534
615
591
576
636
Personnel
42
59
71
90
103
Power, Oil & Fuel
131
128
141
145
160
Others Expenses
74
102
138
169
200
EBITDA
61
90
124
149
153
% chg
(5.1)
48.4
36.8
20.7
2.5
(% of Net Sales)
7.2
9.1
11.6
13.2
12.2
Depreciation& Amortization
19
28
34
35
37
EBIT
42
63
89
114
115
% chg
(1.6)
50.0
42.0
28.3
1.0
(% of Net Sales)
5.0
6.3
8.4
10.1
9.2
Interest & other Charges
23
29
39
39
36
Other Income
1
1
4
4
4
(% of PBT)
4.7
3.9
6.7
4.5
4.3
Share in profit of Associates
-
-
-
-
-
Recurring PBT
20
35
53
79
83
% chg
(11.3)
74.2
51.9
49.3
4.3
Prior Period & Extraordinary Expense/(Inc.)
-
-
-
-
-
PBT (reported)
20
35
53
79
83
Tax
6
11
13
26
27
(% of PBT)
27.9
32.2
25.2
33.0
33.0
PAT (reported)
15
24
40
53
55
Add: Share of earnings of associate
-
2
3
3
3
Less: Minority interest (MI)
-
2
3
3
3
Extraordinary Items
(1)
PAT after MI (reported)
15
25
39
52
55
% chg
1.7
70.9
57.8
34.2
4.3
(% of Net Sales)
1.7
2.5
3.7
4.6
4.4
Basic EPS (`)
4.8
8.2
13.0
17.4
18.2
Fully Diluted EPS (`)
4.8
8.2
13.0
17.4
18.2
% chg
1.7
70.9
57.8
34.2
4.3
February 14, 2018
5
Asian Granito| 3QFY2018 Result Update
Exhibit 3: Consolidated Balance Sheet
Y/E March (` cr)
FY2015
FY2016
FY2017
FY2018E
FY2019E
SOURCES OF FUNDS
Equity Share Capital
23
23
30
30
30
Reserves& Surplus
267
341
371
423
479
Shareholders Funds
290
363
401
454
509
Minority Interest
-
19
22
19
19
Total Loans
175
335
350
320
320
Deferred Tax Liability
18
30
34
30
30
Total Liabilities
483
747
807
831
885
APPLICATION OF FUNDS
Gross Block
338
603
644
694
744
Less: Acc. Depreciation
149
211
239
274
311
Net Block
188
392
405
421
433
Capital Work-in-Progress
15
6
1
6
6
Investments
11
13
17
13
13
Current Assets
438
539
679
627
694
Inventories
191
245
273
285
316
Sundry Debtors
166
197
311
220
240
Cash
15
17
19
21
25
Loans & Advances
21
30
35
56
63
Other Assets
46
50
41
45
50
Current liabilities
168
203
295
236
260
Net Current Assets
270
336
384
391
433
Deferred Tax Asset
-
-
-
-
-
Mis. Exp. not written off
-
-
-
-
-
Total Assets
483
747
807
831
885
Source: Company, Angel Research
February 14, 2018
6
Asian Granito| 3QFY2018 Result Update
Exhibit 4: Consolidated Cashflow Statement
Y/E March ((` cr)
FY2015
FY2016
FY2017
FY2018E FY2019E
Profit before tax
19
35
53
79
83
Depreciation
19
28
34
35
37
Change in Working Capital
49
(64)
(46)
(5)
(38)
Interest / Dividend (Net)
23
29
39
39
36
Direct taxes paid
(6)
(5)
(10)
(26)
(27)
Others
0
(1)
(6)
(1)
(1)
Cash Flow from Operations
104
21
65
121
90
(Inc.)/ Dec. in Fixed Assets
(30)
(224)
(42)
(47)
(50)
(Inc.)/ Dec. in Investments
2
(3)
(3)
3
-
Cash Flow from Investing
(33)
(221)
(38)
(50)
(50)
Issue of Equity
-
8
-
-
-
Inc./(Dec.) in loans
(53)
160
15
(30)
-
Dividend Paid (Incl. Tax)
-
-
(2)
-
-
Interest / Dividend (Net)
(23)
36
(39)
(39)
(36)
Cash Flow from Financing
(76)
203
(26)
(69)
(36)
Inc./(Dec.) in Cash
(4)
3
1
2
4
Opening Cash balances
19
15
17
19
21
Closing Cash balances
15
17
19
21
25
Source: Company, Angel Research
February 14, 2018
7
Asian Granito| 3QFY2018 Result Update
Exhibit 5: Key Ratios
Y/E March
FY2015
FY2016
FY2017E FY2018E FY2019E
Valuation Ratio (x)
P/E (on FDEPS)
107.6
63.0
39.9
29.7
28.5
P/CEPS
46.5
30.4
21.0
17.7
16.8
P/BV
5.4
4.3
3.9
3.4
3.1
Dividend yield (%)
0.0
0.0
0.0
0.0
0.0
EV/Sales
2.0
1.9
1.8
1.6
1.5
EV/EBITDA
28.1
20.7
15.2
12.4
12.1
EV / Total Assets
2.6
2.0
1.7
1.7
1.6
Per Share Data (Rs)
EPS (Basic)
4.8
8.2
13.0
17.4
18.2
EPS (fully diluted)
4.8
8.2
13.0
17.4
18.2
Cash EPS
11.1
17.0
24.7
29.2
30.9
DPS
0.0
0.0
0.0
0.0
0.0
Book Value
96.3
120.7
133.3
150.7
169.3
Returns (%)
ROCE
9.0
9.0
11.9
14.8
13.9
Angel ROIC (Pre-tax)
9.5
9.4
12.4
15.5
14.6
ROE
5.0
6.8
9.8
11.6
10.8
Turnover ratios (x)
Asset Turnover (Gross Block)
2.5
1.6
1.7
1.6
1.7
Inventory / Sales (days)
83
90
92
92
92
Receivables (days)
72
72
72
71
70
Payables (days)
61
57
53
52
52
Working capital cycle (ex-cash) (days)
94
105
111
111
110
Source: Company, Angel Research
February 14, 2018
8
Asian Granito| 3QFY2018 Result Update
Research Team Tel: 022 - 39357800
DISCLAIMER
Angel Broking Private Limited (hereinafter referred to as “Angel”) is a registered Member of National Stock Exchange of India Limited,
Bombay Stock Exchange Limited and MCX Stock Exchange Limited. It is also registered as a Depository Participant with CDSL and
Portfolio Manager with SEBI. It also has registration with AMFI as a Mutual Fund Distributor. Angel Broking Private Limited is a
registered entity with SEBI for Research Analyst in terms of SEBI (Research Analyst) Regulations, 2014 vide registration number
INH000000164. Angel or its associates has not been debarred/ suspended by SEBI or any other regulatory authority for accessing
/dealing in securities Market. Angel or its associates including its relatives/analyst do not hold any financial interest/beneficial
ownership of more than 1% in the company covered by Analyst. Angel or its associates/analyst has not received any compensation /
managed or co-managed public offering of securities of the company covered by Analyst during the past twelve months. Angel/analyst
has not served as an officer, director or employee of company covered by Analyst and has not been engaged in market making activity
of the company covered by Analyst.
This document is solely for the personal information of the recipient, and must not be singularly used as the basis of any investment
decision. Nothing in this document should be construed as investment or financial advice. Each recipient of this document should
make such investigations as they deem necessary to arrive at an independent evaluation of an investment in the securities of the
companies referred to in this document (including the merits and risks involved), and should consult their own advisors to determine
the merits and risks of such an investment.
Reports based on technical and derivative analysis center on studying charts of a stock's price movement, outstanding positions and
trading volume, as opposed to focusing on a company's fundamentals and, as such, may not match with a report on a company's
fundamentals.
The information in this document has been printed on the basis of publicly available information, internal data and other reliable
sources believed to be true, but we do not represent that it is accurate or complete and it should not be relied on as such, as this
document is for general guidance only. Angel Broking Pvt. Limited or any of its affiliates/ group companies shall not be in any way
responsible for any loss or damage that may arise to any person from any inadvertent error in the information contained in this report.
Angel Broking Pvt. Limited has not independently verified all the information contained within this document. Accordingly, we cannot
testify, nor make any representation or warranty, express or implied, to the accuracy, contents or data contained within this document.
While Angel Broking Pvt. Limited endeavors to update on a reasonable basis the information discussed in this material, there may be
regulatory, compliance, or other reasons that prevent us from doing so.
This document is being supplied to you solely for your information, and its contents, information or data may not be reproduced,
redistributed or passed on, directly or indirectly.
Neither Angel Broking Pvt. Limited, nor its directors, employees or affiliates shall be liable for any loss or damage that may arise from
or in connection with the use of this information.
Note: Please refer to the important ‘Stock Holding Disclosure' report on the Angel website (Research Section). Also, please refer to the
latest update on respective stocks for the disclosure status in respect of those stocks. Angel Broking Pvt. Limited and its affiliates may
have investment positions in the stocks recommended in this report.
Disclosure of Interest Statement
Asian Granito
1. Analyst ownership of the stock
No
2. Angel and its Group companies ownership of the stock
No
3. Angel and its Group companies' Directors ownership of the stock
No
4. Broking relationship with company covered
No
Note: We have not considered any Exposure below ` 1 lakh for Angel, its Group companies and Directors
February 14, 2018
9
Ratings (Based on expected returns
Buy (> 15%)
Accumulate (5% to 15%)
Neutral (-5 to 5%)
over 12 months investment period):
Reduce (-5% to -15%)
Sell (< -15)